14.
Slopes
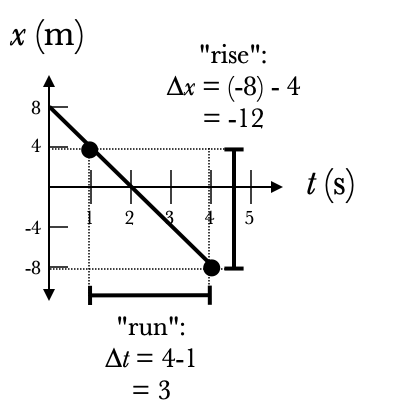
The slope of a graph is equal to the change in the vertical between two points divided by the change in the horizontal; colloquially this is described as "rise over run".
In the graph on the right, the "rise" is the change in the $x$ value: $\Delta x=-12\u{m}$. The "run" is the change in the $t$ value: $\Delta t = 3\u{s}$. Thus the slope of this line is $$\text{slope}={\Delta x\over\Delta t}=-4\u{m\over s}$$
This quantity, displacement divided by a time interval, is the average velocity between the two points:
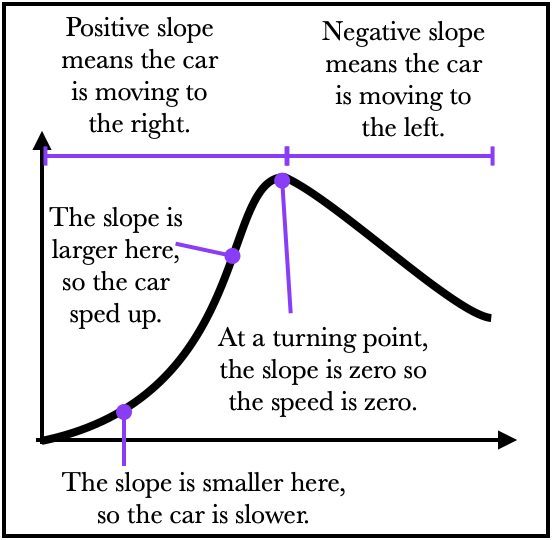
The slope of a position graph gives you the velocity.
In this case, the slope is negative and so this object is moving to the left. Here is a more complicated position graph: