6.
History Graphs
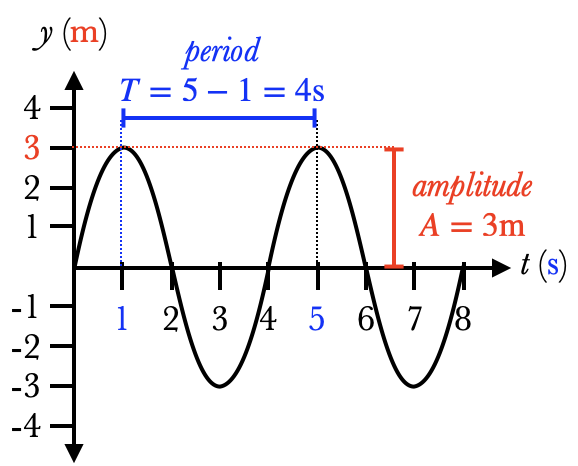
This is a history graph of an oscillation, because it shows how the displacement $y$ changes with time $t$. You can learn a lot about an oscillation from a history graph:
- The equilibrium point is the horizontal line across the middle, where $y=0$
- The amplitude of the oscillation is the distance from the equilibrium point to the highest point on the graph. (For a sinusoidal oscillation, the amplitude is half the total height of the graph.)
- The period $T$ of the oscillation is the time difference between two maxima (or two minima, or between any two points which look identical).
- To find the frequency of the oscillation, we first find the period and then take the reciprocal. In this case, $f={1\over T} = {1\over 4\u{s}} = 0.25\u{Hz}$
- You can find the initial phase $\phi_0$ of the graph by matching it with the four options on Simple Harmonic Motion. This particular graph matches $\phi_0={3\pi\over 2}$
- Once we have $A$, $T$, and $\phi_0$, we can write the complete expression for the displacement as a function of time. For this example, we have $$y(t) = 3\cos\left(2\pi {t\over 4} + {3\pi\over 2}\right)$$